Because the U.S. farm sector is capital intensive, debt financing has long played a critical role in funding the agricultural investments of operations. With farm income having dropped and continuing to decline, there is beginning to be more attention paid to the level of debt in the U.S. farm sector. This week we will examine some of the broad trends in farm debt use.
Debt Continues Higher
Figure 1 shows USDA’s estimate of total farm sector debt in nominal dollars from 2010-2018. Today, the total indebtedness stands at $407 billion. Total debt has grown steadily, increasing by 46% since 2010 (an annual compound growth of 5% per year). The total interest cost on this debt is forecast to be $21.9 billion dollars for 2018.
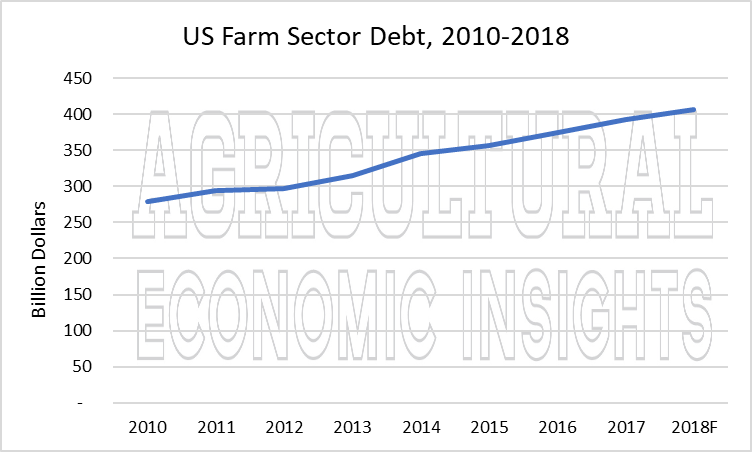 Figure 1. Total U.S. Farm Sector Debt, 2010-2018f.
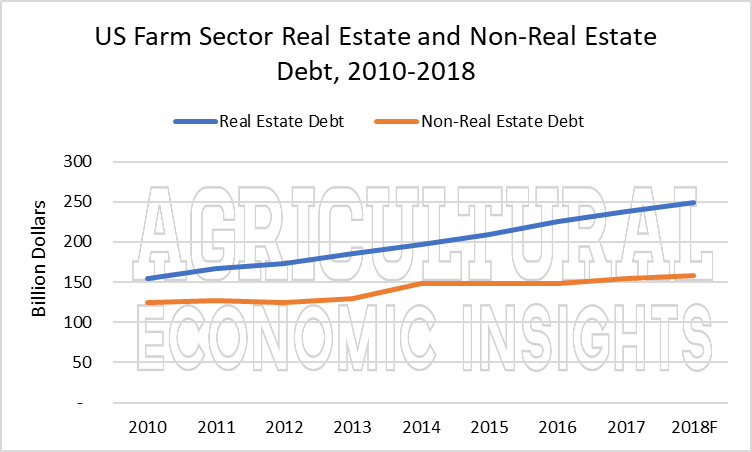
When one looks at the components of the total debt it becomes clear that real estate debt has accounted for the majority of the increase (figure 2). At $248 billion, real estate debt currently accounts for 61% of total debt. This share has increased since 2010 when it accounted for 55% of total debt.
The increasing use of real estate debt has likely been driven by a couple of factors. First, long-term interest rates have remained low which provides an incentive to utilize long-term financing on real estate. Second, the drop in farm income has likely made it necessary for farmers to utilize agricultural real estate for collateral. Third, farmland prices increased over this time period often resulting in more borrowings when farmers purchase farmland. Additionally, it is likely that lenders have sought to refinance borrowers and secure loans with real estate during the farm income downturn.
Figure 2. Real Estate and Non-Real Estate Debt, U.S. Farm Sector, 2010-2018f.
Real Debt Levels Continue to Rise as Well
The previous description looked at nominal changes in debt levels. To provide a bit more perspective on debt levels we examined real debt levels (2018 dollars) over the period of 1970-2018. These are shown in Figure 3. This figure shows the rapid growth in real debt leading up to the 1980’s and the rapid deleveraging of the farm sector in the late 1980s. From there, real farm debt grew modestly until roughly the mid-2000’s. Since then, the growth has been more rapid. Today, real farm debt is just short of it’s previous high. If it were to grow roughly another 4% in 2019, something that seems fairly likely at present, it would eclipse the previous high.
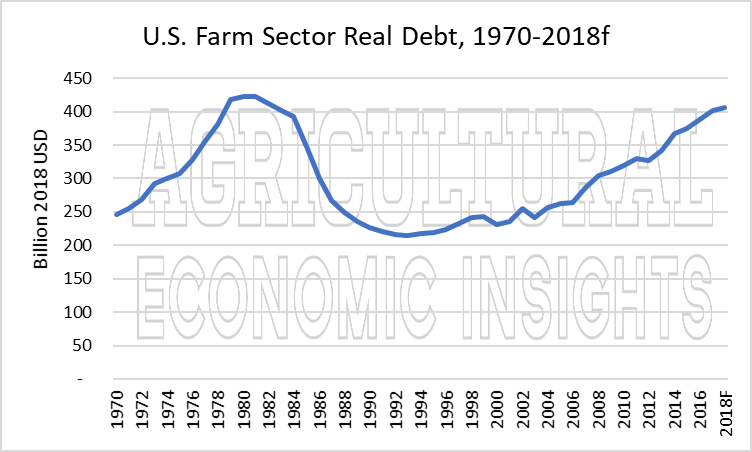 Figure 3. Real (2018 USD) Total U.S. Farm Sector Debt 1970-2018f.
Looking at the inflation-adjusted values of the components of debt further reinforces the rapid growth in real estate debt. While the total debt remains slightly below the previous peak, real estate debt is actually 11% higher today than it was during the early 1980’s (figure 4). In real dollars, the amount of real estate debt has grown by 107% from 2000 to 2018 for a real compound growth rate of 4%.
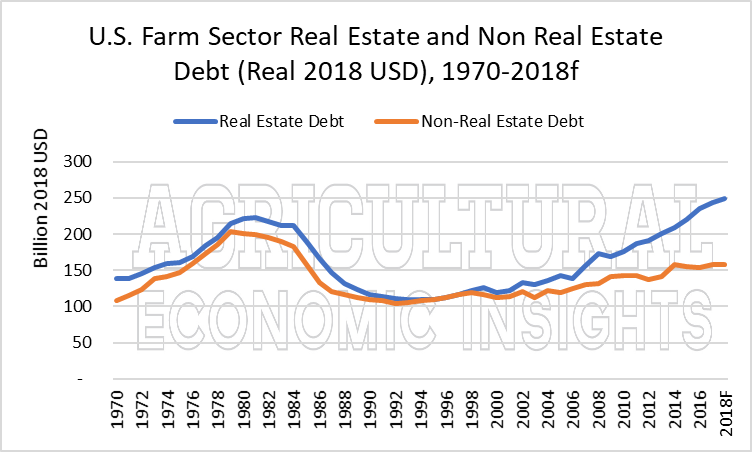 Figure 4. Real Value (2018) of US Farm Real Estate and Non-Real Estate Debt, 1970-2018f.
Farm Sector Investments Fall
When looking at the sector balance sheet the increase in debt is rather obvious. Another interesting trend is the large decline in assets categorized by USDA as Investments and Other Financial Assets (figure 5). These assets are broken out into categories for investment in cooperatives and investments in financial assets. In total, they have fallen by $62 billion in 8 years.
Financial assets are by far the largest component of the category. While investments in cooperatives actually increased by $700 million over this time period, investments in financial assets have fallen sharply. From 2010 to 2018 financial assets on the farm sector balance sheet declined by $62 billion, or 50%. So in other words, farmers have reduced their holdings of financial assets sharply while adding significant amounts of debt over this time period.
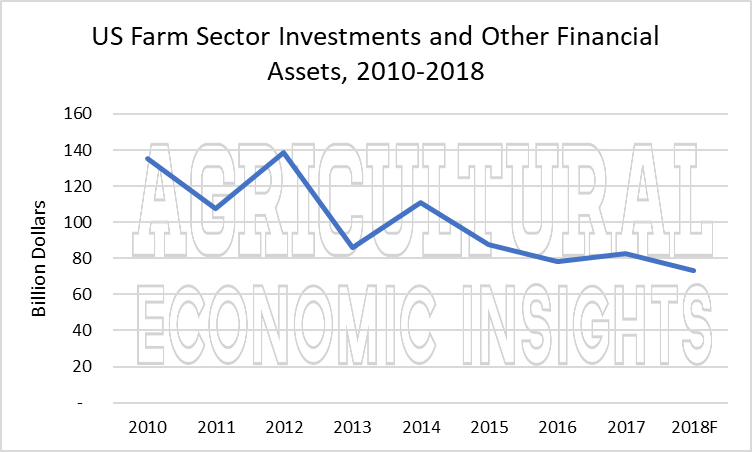 Figure 5. U.S. Farm Sector Investments and Other Financial Assets, 2010-2018f.
Wrapping it Up
Farm debt has continued to grow as farm incomes have fallen. The biggest component of this growth has been for debt associated with farm real estate. Real estate debt now accounts for the highest proportion of total debt that we have seen in the data.
Real estate debt tends to have much longer repayment terms than other farm debt and its use has likely helped keep debt service more manageable. Whether the current levels are too high depends upon the cash flow generation of the farmers that are servicing the debt. It is important to remember that debt is not uniformly distributed across the farm sector. In other words, some may have way too much debt and others none at all.
Coinciding with recent increases in total debt is a large decline in the amount of financial assets held by the farm sector. These assets have fallen by half since 2010. This is likely indicative of the tough financial times being experienced in the sector. As farmers’ financial conditions have deteriorated, financial assets have been converted and total debt has increased to meet capital investment and operating needs.
While converting financial assets and adding long-term debt is a reasonable strategy during a downturn, one must wonder how much further current trends will extend. The amount of financial assets has already declined significantly and has a limited amount left to go. In the case of real estate debt, there is additional debt bearing capacity at the sector level. The question will become how much more real estate debt producers are willing to add, and how much lenders are willing to provide.

