A couple of weeks ago we looked at how soybean acreage has changed across the country. The idea was to get a sense for where soybean acreage might contract in 2019. What we observed was that acreage has tended to fluctuate the most across the Northern and Southern Great Plains. This week we take a look at how cash prices vary across regions of the country.
While the soybean to corn price ratio deservedly gets a great deal of attention, people rarely discuss how prices differ across the country. Instead, we often simply look at the ratio of November soybean futures to December corn futures prices. While this is an interesting metric, it obscures the considerable variation in cash prices across the country and how planting signals might vary from region to region.
To take a closer look at this issue we examined NASS’s estimate of the average monthly cash price for various soybean producing states. We examined monthly cash prices for several states from 2010-2018. Of the major soybean producing states, we will present results for IL, IA, MN, SD, ND, and KS.
Where are Prices Highest?
Of the states and dates that we examined, IL was home to the highest average soybean cash prices. Not surprisingly these are the largest soybean producing states in the U.S. Iowa was the second largest producing soybean state and soybean prices in Iowa were slightly lower than those in Illinois. The difference between Illinois and Iowa monthly cash prices is shown in figure 1.
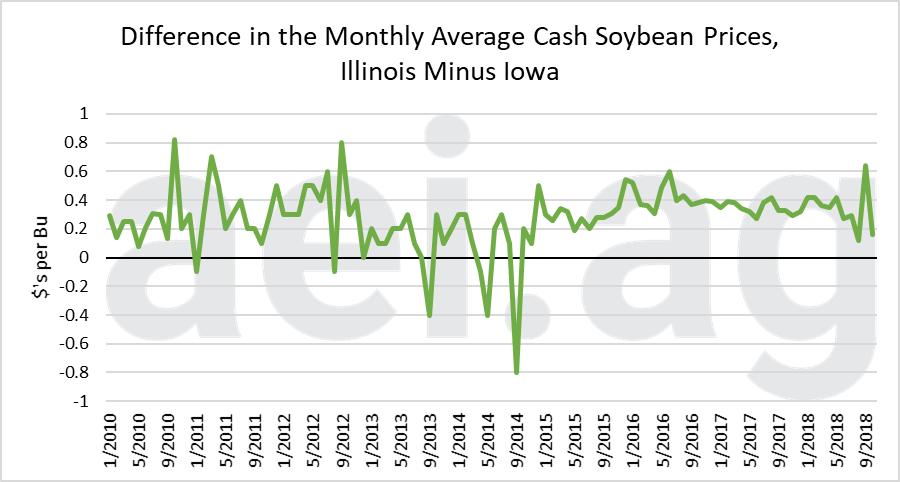
Figure 1. Difference in the Monthly Average Cash Soybean Price, Illinois Minus Iowa 2000-2018.
On average, Illinois cash soybean prices were $0.27 higher than those in Iowa. However, you will note that the relationship occasionally inverted. For instance, from the second half of 2013 to late 2014 Iowa cash prices occasionally spiked higher than those in Illinois. But in general, the prices in Illinois have consistently been higher than in Iowa and all of the other states considered.
Taking a look at the Dakotas
As we discussed earlier, the Dakotas have seen tremendous growth in soybean acreage in the last decade. There have been many anecdotal stories about the wide soybean basis in the Dakotas, so we decided to compare prices to those found in Illinois. Figure 2 shows the cash soybean prices in South Dakota (blue line) and North Dakota (red line) versus those in Illinois.
The graph makes clear the wide differences in price that producers in these states face relative to Illinois. On average the cash soybean prices in North Dakota were $0.79 per bushel less than in Illinois. South Dakota prices were usually a bit better, but still averaged $0.63 less than Illinois.
As you can tell the cash price in North Dakota tends to be lower and more variable than in South Dakota. While recent headlines highlight the basis woes in the Dakotas, the North Dakota basis has been even wider in previous years. For instance, cash prices in North Dakota were nearly two dollars per bushel less than Illinois prices in 2014. The other interesting fact is that according to NASS, prices in South Dakota have recently been lower than those in North Dakota.
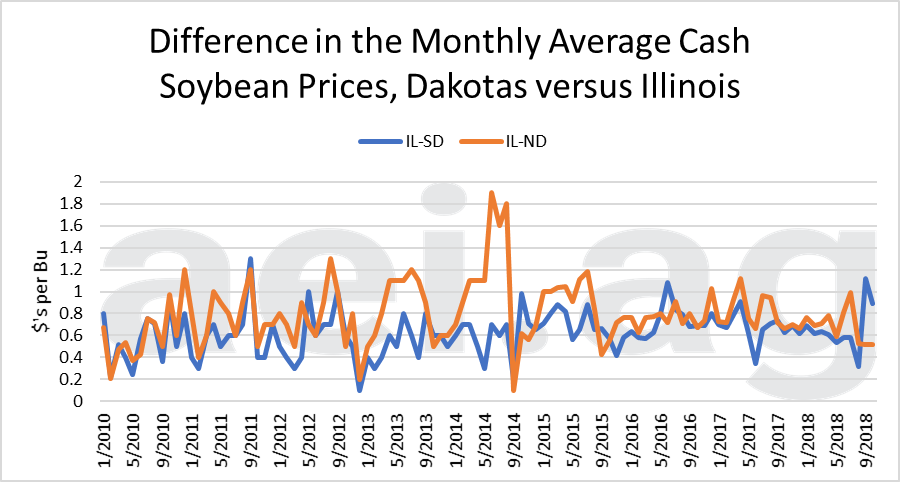
Figure 2. Difference in the Monthly Average Cash Soybean Price, Illinois Minus North and South Dakota 2000-2018
Kansas and Minnesota
Kansas and Minnesota were also states that we identified as having a tendency for large soybean acreage changes. On average Kansas soybean producers received $0.35 less and Minnesota soybean producers received $0.41 less than those in Illinois. However, you will note that much of the reason that the average prices in Kansas were closer to Illinois goes back to the 2010-2011 time period when Kansas prices were higher than those in Illinois.
Late in 2018, the relationship has changed significantly, with Minnesota producers enjoying prices much closer to those in Illinois. As of October, cash prices in Minnesota were nearly $0.70 higher than those in Kansas.
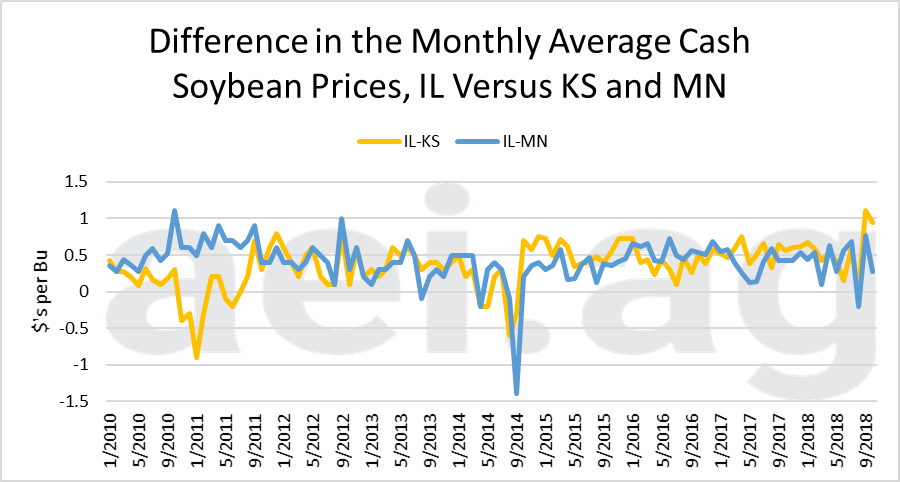
Figure 3. Difference in the Monthly Average Cash Soybean Prices, Illinois, Kansas, and Minnesota.
Wrapping it Up
When thinking about soybean acreage changes it is important to consider not just the overall soybean/corn price ratio, but also how cash soybean prices vary across the country. When looking among the major soybean producing states, Illinois farmers tend to enjoy the highest cash prices, whereas farmers in the Dakotas experience some of the weakest cash prices.
The incredible growth in Dakota soybean acreage has come despite cash prices that are much lower than those in the Central corn belt. One has to wonder whether cash prices are now approaching levels that will deter producers in the Dakotas from planting soybeans. In Kansas and Minnesota, cash prices were much closer to central corn belt prices. However, there has been a recent divergence in Kansas with prices falling $1.00 per bushel below Illinois levels. It is difficult to know whether this will persist, whether it is a short-term phenomenon, or how it might be influenced by the current trade war.
We are now roughly one-third of the way through the crop insurance price discovery period. As of Feb 10th, the corn price guarantee stood at $4.03 and within pennies of last year’s $3.99. Soybeans are now $0.57 lower than in 2018. As we head toward planting we would expect that such differences will begin to swing the needle toward more corn and fewer soybeans.