Perhaps the biggest agricultural demand story of the 21st century has been China.
Accounting for more than 18% of the global population, China’s large population – of 1.4 billion – has also experienced a dramatic rise of per-capita income. These two demand factors have occurred as domestic production in China has struggled to keep up, creating a significant reliance on imports. Total acreage of crop production in China has been mostly stable since 1990, while consumption of crops has grown dramatically. China currently relies on imports for about 100 million acres worth of crop production or roughly 25% of total crop consumption.
This week’s post steps back and considers the trends in China’s production, consumption, and imports of 12 agricultural commodities.
Soybeans
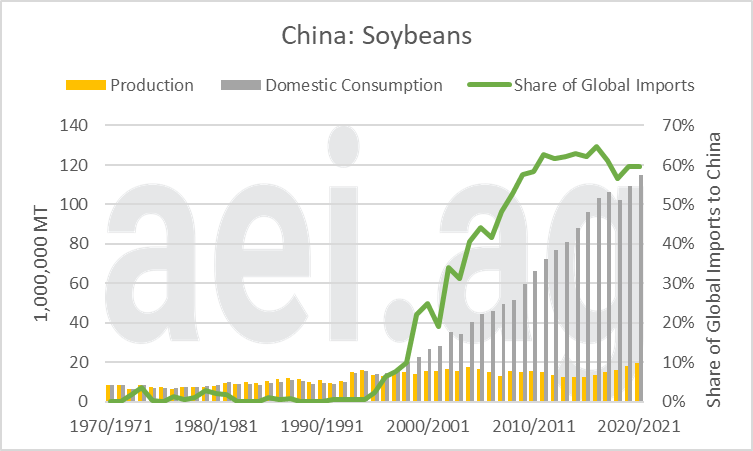
If there was one chart that captured the optimism, enthusiasm, and possibilities of trade with China it would be soybeans. From the 1970s until the late 1990s, China’s production and consumption of soybeans was nearly lock-step. Around 2000, however, China’s consumption of soybeans surged from 20 million metric tonnes to 114 million for the 2020/21 marketing year. Over those two decades, China’s soybean consumption increased at an average annualized of 7.6%, a large growth rate sustained over a long period of time.
Since the early 2000s, China’s production of soybeans has been mostly unchanged. This has resulted in China’s relying on imports, which account for more than 60% of globally imported soybeans.

Corn
China is the second-largest producer and consumer of corn in the world. Production and consumption have been essentially in lock-step since the 1970s, with significant increases for both. For the last three years, however, domestic consumption has outpaced production and China has become a significant importer.
For the 2020/21 marketing year, China purchased about 13% of the globally traded corn, the largest share observed in the data. While China has purchased sizable quantities of corn historically, recent activity has been the largest. Looking ahead, it remains to be seen if China returns to self-sufficiency and backs off the buying spree, as has been the case historically, or if it becomes a regular global buyer of corn.

Rice
Rice is an important global commodity and one where China’s production and consumption have grown at similar paces. It’s worth noting the growth trend for both production and consumption has slowed since 2000. For example, domestic consumption of rice grew at an average annualized growth rate of 1.7% from 1970 to 2000. Since 2000, however, consumption has grown at only 0.6% annually.
On the trade front, China’s purchases have accounted for roughly 10% of global imports but have turned lower most recently.

Sorghum
Sorghum is a crop that has been on China’s shopping list in recent years. Overall though, China’s long-run history with sorghum has been one of diminishing interests.
China’s production peaked in the mid-1970s at 10 million metric tonnes before falling below 2 million MT around 2000. Domestic consumption, driven largely by trade policy, has hit highs in recent years. In 2020/21, China’s domestic consumption was nearly 11 million metric tonnes, compared to 3.6 million metric tonnes of production. China’s import purchases accounted for a staggering 85% of global trade.
While production and consumption scales are vastly different, it’s worth noting the sorghum story isn’t occurring in a vacuum and should be taken in context with the current corn situation.

Wheat
Wheat production and consumption in China were stagnant throughout the 1990s and early 2000s. While levels are slightly higher in recent years, China’s production has largely outpaced domestic consumption for many years in the last decade. Furthermore, China’s significance in global trade peaked around 1980 – at nearly 20% of global trade of wheat – and has trended lower since.

Cotton
China is reliant on cotton imports to satisfy domestic consumption, but it’s been a bumpy ride. First, cotton usage cotton peaked around 2010 at nearly 50 million bales before turning lower. For 2020/21, consumption is nearly 40 million bales.
As China’s usage of cotton re-calibrated in the last decade, so did domestic production and China’s role in global trade. In 2011/12, China’s purchase accounted for 54% of global trade but fell to just 12% by 2015/16. Currently, China accounts for 26% of global trade.

Milk
A key commodity in the dairy trade is dry whole milk powder. China’s domestic consumption of dry milk powder milk has increased since the 1990s and has outpaced domestic production since 2010. China has become a large global buyer of dry milk powder, accounting for more than 60% of global trade.

Total fluid milk consumption and production in China jumped higher in the early 2000s. From 2000/01 to 2006/07, domestic consumption went from 8 million metric tonnes to 33 million metric tonnes, or more than a 4x increase in just seven years. Since then, however, domestic production and consumption and production have been largely flat.
Trade of fluid milk consumption is complicated given the bulkiness of fluid milk (8.6 pounds per gallon) and perishability. That said, global trade of milk does occur on a limited basis, with China accounting for about 60% of fluid mix trade. But – less than 1% of global fluid milk consumption is traded, and trade only accounts for 2.7% of China’s consumption.

Nuts
Just a few years ago, many wondered about China’s buying spree of nuts. In 2012/13, China’s purchases accounted for 21% of globally traded walnuts, up from 3% just five years before. That, however, turned out to be the peak of China’s growing share of trade activity. Today, China’s walnut imports account for 2% of global trade, and China’s production has exceeded domestic consumption in recent years. Furthermore, consumption in recent years is lower than highs of just six years ago.

Meat
China’s production, consumption, and import activity of beef partially resembles the soybean graph, perhaps just fifteen years later. Since the mid-2000s, China’s domestic production has plateaued around 6 million metric tonnes, while domestic consumption now approaches 9.5 million metric tonnes.
The gap between consumption and production has resulted in more global trade In 2020/21, China accounted for nearly 30% of global beef trade. For context, China essentially imported zero beef prior to 2010.

Data on chicken trends in China are available since 2000. Consumption and production increased through 2012/13, before trending lower through 2018/19. Production and consumption have since turned sharply higher, driven largely by the need for alternatives in light of the African Swine Fever outbreak in pork. In 2020/21, production and consumption reached 20-year highs. Furthermore, China’s chicken imports have also increased as China purchased 10% of global chicken trade.

Finally, several of the observations we’ve noted throughout the post can be spotted in just one chart: pork. First, domestic consumption grew strong for decades before peaking at 58 million MT in 2014/15. Since peaking, consumption and production stalled for several subsequent years. The downturn in pork consumption – which was similar to chicken – correlates with the uptick in beef consumption.
Second, the effect and significance of African Swine Fever are clear in the data. In 2018/19, production was 54 million MT before falling to 36 million MT for 2020/21, a 33% decline. Prior to ASF, China’s purchases accounted for roughly 20% of global trade but surged to nearly 50% for 2020/21.
To predict the future of pork consumption in China, one has to weigh the decades-long trend in pork consumption, the recent consumption slide corresponding with beef’s uptick, potential ASF effects moving forward, and China’s growing role as a pork importer.

Wrapping it Up – Future of China Ag Imports
Soybeans in China have become the poster child of potential and enthusiasm about global trade. Even in 2021, soybeans’ success story tilts our thinking when we consider where China’s production, consumption, and imports of corn and beef will head in the next decade.
While the demand story out of China has been significant and will continue to be for many years, that events of the last five years have been a bit bumpy is important to keep in mind.
First, the Chinese demand story hasn’t played out uniformly across commodities, or even consistently for given commodities. For example, pork’s well-known demand story has stalled in recent years, even before being hard-hit by ASF. Consumption has also stalled or slipped with walnuts, fluid milk, and rice.
Second, the effects of trade policy – favorable and unfavorable – can be seen with sorghum.
Looking ahead, the outlook for China likely holds strong growth in consumption and more reliance on imports. But trends will also be altered by consumer preferences and habits, policies, trade disruption, and global events such as ASF. In short, it will become harder to point to China and make a blanket, generic statement about strong demand for agricultural commodities.