Carving Out the Latest U.S. Pumpkin Production Data

According to the National Retail Federation, 44% of Americans plan to carve a pumpkin as part of their Halloween festivities this year. Have you ever wondered how far your Jack-o’-lantern might have traveled to reach your doorstep?
This post explores key stats about pumpkin production in the United States and challenges facing the industry in 2021.
Which State is Pump-king?

Figure 1. Top Ten Pumpkin Producing States. Data Source: 2017 Census of Agriculture, aei.ag calculations.
While pumpkins are grown in every state in the U.S., just six states produce most of them. One state, in particular, is a pumpkin powerhouse. In 2020, Illinois harvested more than twice as many pumpkin acres as any of the other top states, at 15,900 acres.
Illinois has become the pumpkin capital of the U.S. thanks to its soil and climate, which are ideal for growing pumpkins, and because in the early 1900s pumpkin processing plants were established in Morton, Illinois, officially putting the area on the pumpkin map.
California, Indiana, Michigan, Texas, and Virginia each harvested between 3,700 and 6,000 acres in 2020. Together with Illinois, these top six pumpkin-producing states harvested more than 1 billion pounds of pumpkins combined.
Which states produce the least? At the bottom of the list, 21 farms raised pumpkins in Alaska in 2017, harvesting a total of 4 acres. Similarly, Wyoming had 9 farms harvest 10 acres.
Farm Demographics

Figure 2. Distribution of Fresh Market Pumpkin Production, acreage (in blue), and operations (in orange). Data Source: 2017 Census of Agriculture, aei.ag calculations.
Farms that harvest less than one acre of pumpkins account for 49% of operations, but only 2% of harvested acreage. At the other end of the spectrum, 55% of total acreage is harvested by farms with more than 25 acres, but these operations represent only 4% of all operations.
Where Do All Those Pumpkins Go?

Figure 3. Harvest Pumpkin Acreage by Usage, 2017. Data Source: 2017 Census of Agriculture, aei.ag calculations.
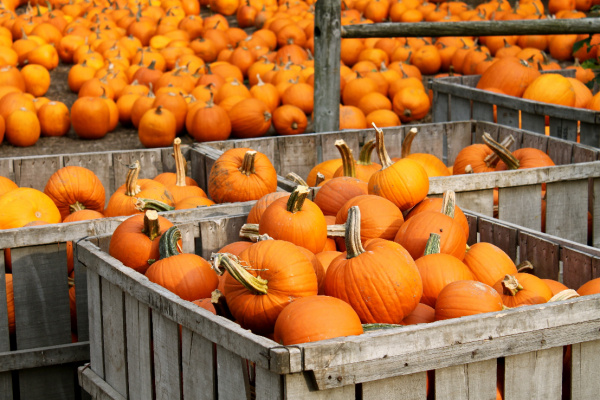
In 2017, there were 93,600 acres of pumpkins harvested, the majority destined to become Jack-o’-lanterns in the fresh market.
In contrast with other states, 79% of Illinois pumpkin acreage in 2017 was for processed pumpkins, destined for pie fillings and other baked treats. That is well above the national average of 19% of acreage. The 13,800 acres of processed pumpkin harvest not only skewed the acreage share of Illinois, but they also account for a whopping 76% of total U.S. processed acreage.
The Libby’s brand is reported to have almost 90% of the North American market for canned pumpkin, with 90% of it sold in only four months, from October to January.
Gourd Variety and Value
Most pumpkins grown in the U.S. are the traditional Jack-o’-lantern variety, called Howden, that you find at a pumpkin patch. But the term “pumpkin” actually refers to members of four different species, C. moschata, C. mixta, C. pep, and C. maxima, and pumpkins range in size from less than one pound to more than 1,000 pounds. Demand for specialty pumpkin varieties like White Howden, Blue, Cinderella, and Fairytale continues to grow.
Different varieties of pumpkins receive different prices. While Illinois produces the most pumpkins, the varieties they grow there for processing are priced lower than Jack-o’-lantern pumpkins.
Up until 2020, California received the highest price for its pumpkins. That year, Texas’ value of pumpkin production reached $25.9 million, officially surpassing all other states. Dry weather in Texas led to higher quality and lower yields, contributing to higher prices.
The popularity of pumpkins has led to the development of the “pumpkin spice industrial complex,” which reached a value of more than $600 million in 2018 – and keeps growing.
Pumpkin Problems in 2021
If you are one of the millions of Americans who celebrate Halloween with a Jack-o’-lantern or two, be forewarned: your search for the perfect pumpkin might be a bit more challenging this year. That’s because the festive orange gourds haven’t been immune from this year’s widespread supply chain challenges.
One pumpkin distributor that ships millions of pumpkins around the country each year estimates that they have been 40 to 50 loads behind schedule all season long. That’s thanks in part to pallet and cardboard box shortages, the current lack of trucking capacity, and higher freight rates.
Extreme weather and an invasive fungus have also hurt some pumpkin yields. The fungus may affect the future availability of canned pumpkin more so than fresh, Jack-o’-lantern pumpkins.
While the pumpkin shortage does not appear to be dire, what happens if you can’t find a pumpkin in time for Halloween? You might have to get creative. Pineapples are even being suggested as an alternative for Jack-o’-lanterns. You could also get your pumpkin fix by road-tripping to visit the world’s largest pumpkin – which ironically is not in Illinois, but Manitoba!