Three Ways to Measure the Impact of Exchange Rates on U.S. Agriculture

While interest rates are top of mind, exchange rates have also been moving. More specifically, the U.S. Dollar has become stronger or more expensive than other currencies. Figure 1 shows a broad measure of the dollar index. The dollar briefly peaked in the early days of the COVID-19 pandemic – when uncertainty about the virus was greatest.
After turning lower, the dollar has again trended more expensive over the last year. But how do exchange rates affect U.S. farmers? This week’s post – which summarizes recent AEI Premium articles (here and here) – highlights three reasons why it is hard to nail down the exact implications of a higher dollar for agriculture.

Figure 1. U.S. Dollar Index, Nominal, Broad. 2007-2022. Data Source: St. Louis Federal Reserve, FRED.
#1. Stronger, But Not Uniformly
Figure 2 shows Indices of the dollar versus emerging (in blue) and advanced (in red) economies. While the broad story is the “dollar is stronger” (Figure 1), these data reveal that the changes over the last year have primarily been experienced in advanced economies. You can consider two extreme examples with the Brazilian Real and the Euro.

Figure 2. U.S. Dollar Index, Nominal, Emerging (in Blue) and Advanced (in Red) Economies. Data Source: St. Louis Federal Reserve, FRED.
#2. Higher Commodity Prices and a Strong Dollar
In blue, Figure 3 shows an index of farm-level corn prices in the U.S. (Jan. 2010=100). Generally speaking, commodity prices in recent months have mainly been on par with conditions around 2012 and 2013.
The chart also captures a different exchange rate environment today. Specifically, U.S. farm-level prices were converted to local currency for Japan, Mexico, and China. To clarify, these aren’t the prices that international buyers specifically face but, instead, show U.S. farm prices in the various currencies.
While farm-level prices aren’t much different than a decade ago, those prices converted to Japanese Yen and Mexican Pecos are vastly different. This means today’s U.S. farm-level corn prices are considerably higher due to exchange rates. In general, the last time commodity prices were higher the dollar was weak, or cheap. Today, however, the higher commodity prices coincide with a stronger currency.

Figure 3. Relative U.S. Corn Price in Local Currencies (Jan. 2010 = 100), Jan. 2010 – June 2022. Data Source: St. Louis Federal Reserve, USDA NASS, and AEI.ag Calculations.
#3 The Dollar Versus Export Competitors
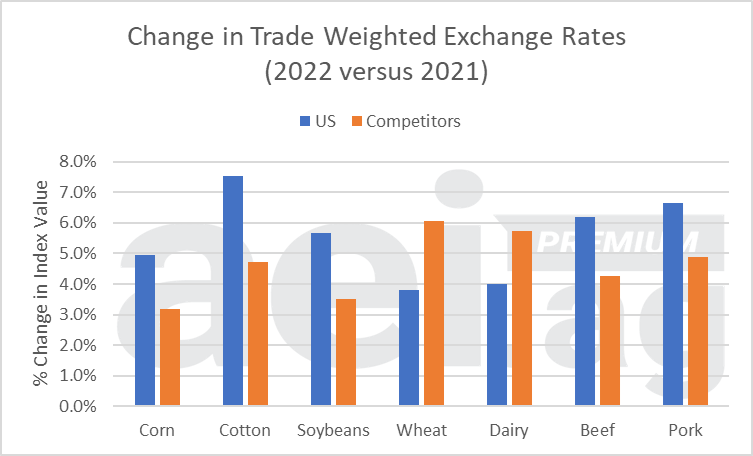
Figure 3 provides commodity-level insights. These data are from the USDA’s commodity-specific, trade-weighted exchange rates. In blue, we can see that cotton, pork, beef, and soybeans have seen the largest year-over-year changes in their indices.
Comparing U.S. and competitor data (in orange), we can consider how U.S. exports might stack up for international buyers. For corn, cotton, soybeans, beef, and pork, the year-over-year index changes have been larger for the U.S. than for export market competitors. While many factors go into the decision of buying, say, soybeans from the U.S. or a competitor such as Brazil, these data show that the dollar has increased 5.7% while the exchange rates for competitors have increased just 3.5%. If exchange rates are going to be a hurdle for U.S. export, it’s most likely to occur in these situations.

Figure 4. Change in Trade Weighted Exchange Rates, 2022 versus 2021. Data Source: USDA ERS and AEI.ag calculations.
Wrapping It Up
Broad statements and observations about the dollar and exchange rates can be difficult to triangulate to specific implications for agriculture. At a high level, a more expensive dollar – all else equal – means it takes international buyers more local currency to buy U.S. ag commodities.
At the commodity level, however, there are many moving pieces. As discussed in this article, conversations about the dollar should also consider 1) trends in the specific exchange rates of potential buyers, 2) the magnitude of exports – as well as the composition of trade partners – varies, and 3) the exchange rates of export competitors can also create challenge or opportunities.
Lastly, and perhaps most frustrating, is the reality that exchange rates – like interest rates – are exogenous to the ag economy. In addition to the difficulty of nailing down the specific implications of a more expensive dollar, there is also little that producers can do to offset the effects.